The OBD app that thinks.
MotoInsights AI turns your OBD-II adapter into a structured diagnostic reasoning engine — reading live sensor data, spotting trends before the check engine light, and explaining what's really going on under the hood.
 About MotoInsights AI
Built on one simple idea: your vehicle data should actually mean something.
Most OBD-II apps are data display tools. They show you numbers and hope you know what to do with them. MotoInsights AI is different — it's a diagnostic reasoning engine that interprets those numbers, compares them against healthy baselines, and tells you what it sees, why it matters, and what to do next.
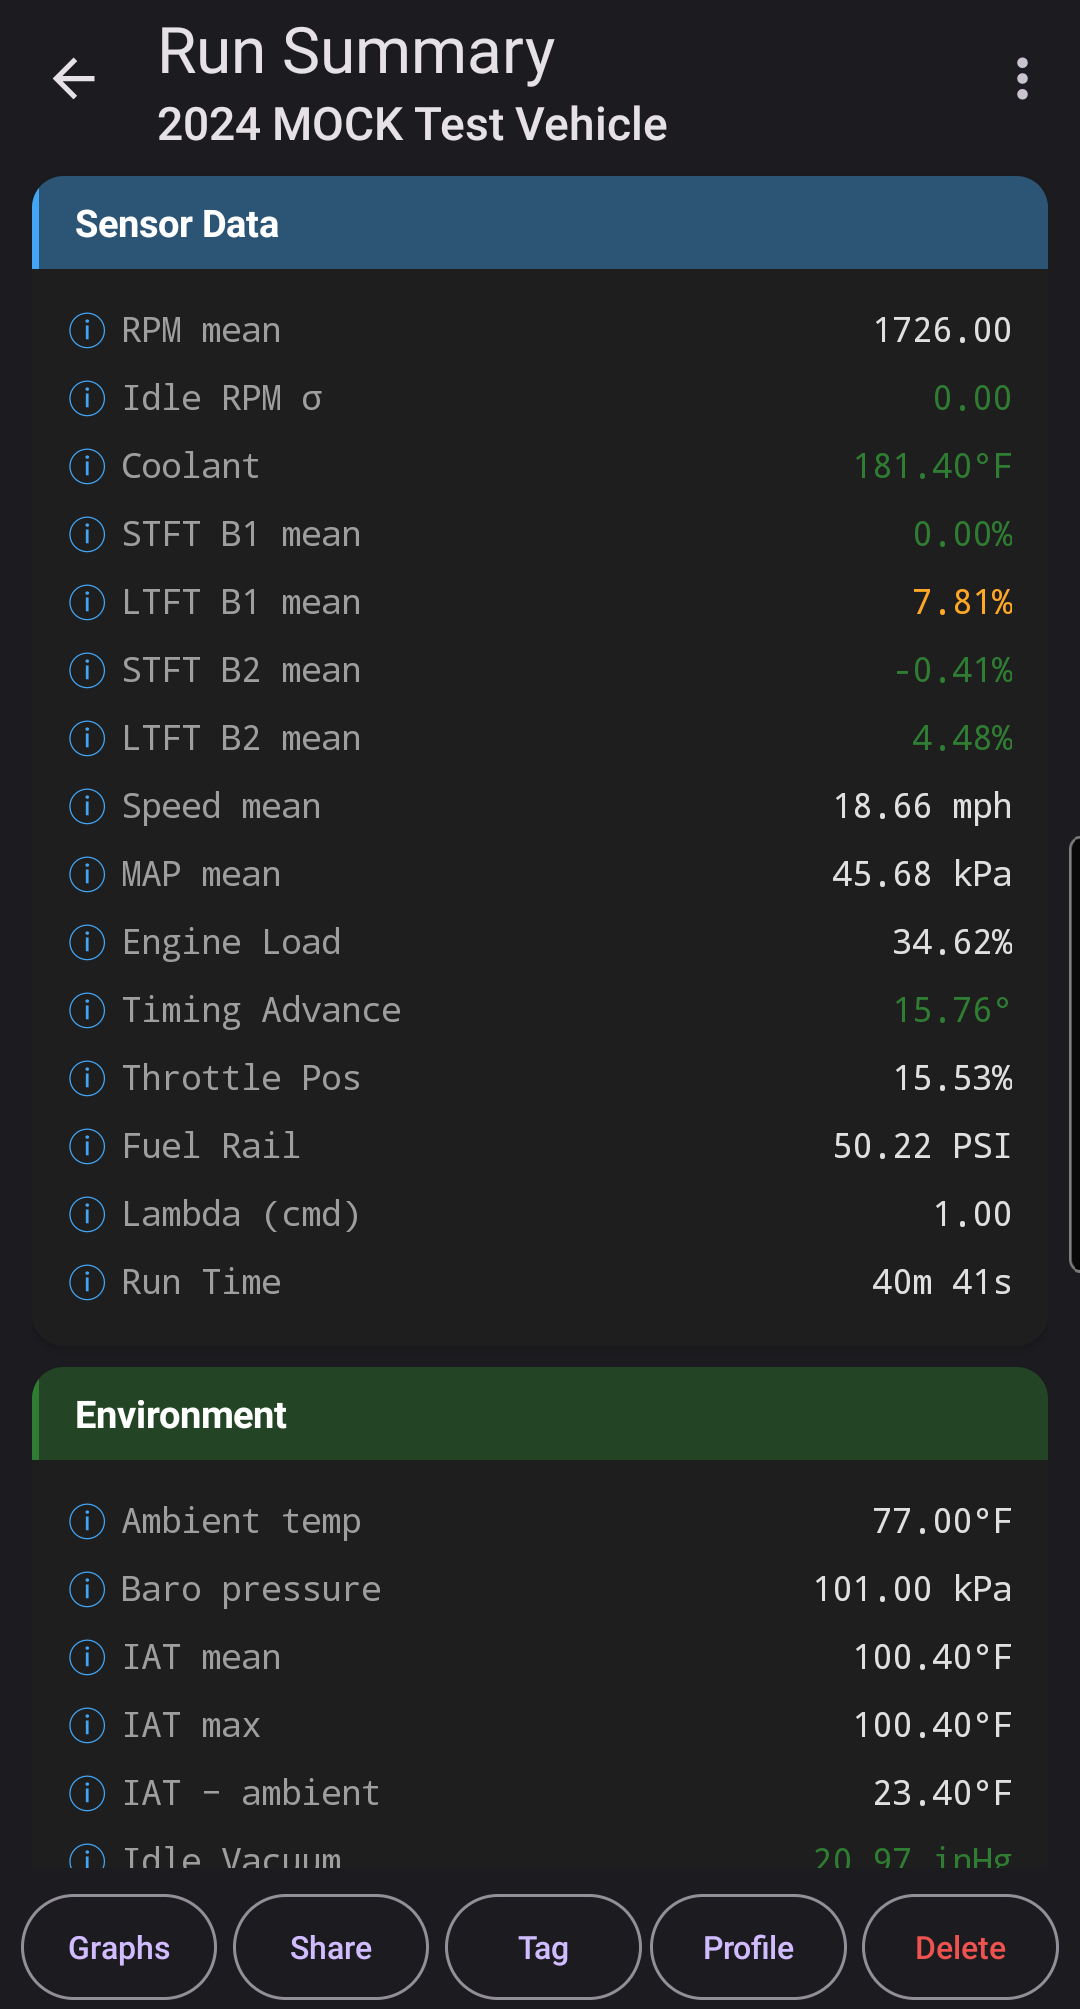
Connect a Bluetooth Low Energy (BLE) ELM327 adapter to your car, hit Record Drive, and the app captures live telemetry — RPM, speed, fuel trims, coolant temperature, MAP, MAF, O2, and more. When the run ends, a layered inference engine extracts features, evaluates diagnostic hypotheses (vacuum leaks, ignition roughness, fuel trim imbalance, lazy O2 sensors, thermostat faults, catalyst degradation), and produces a plain-English summary backed by evidence.
Every diagnosis comes with its reasoning. No black-box outputs. No ad tracking. No account required. The app works offline, stores your data locally, and only reaches the cloud when you ask it to.
Features
AI Deep Diagnosis Pro
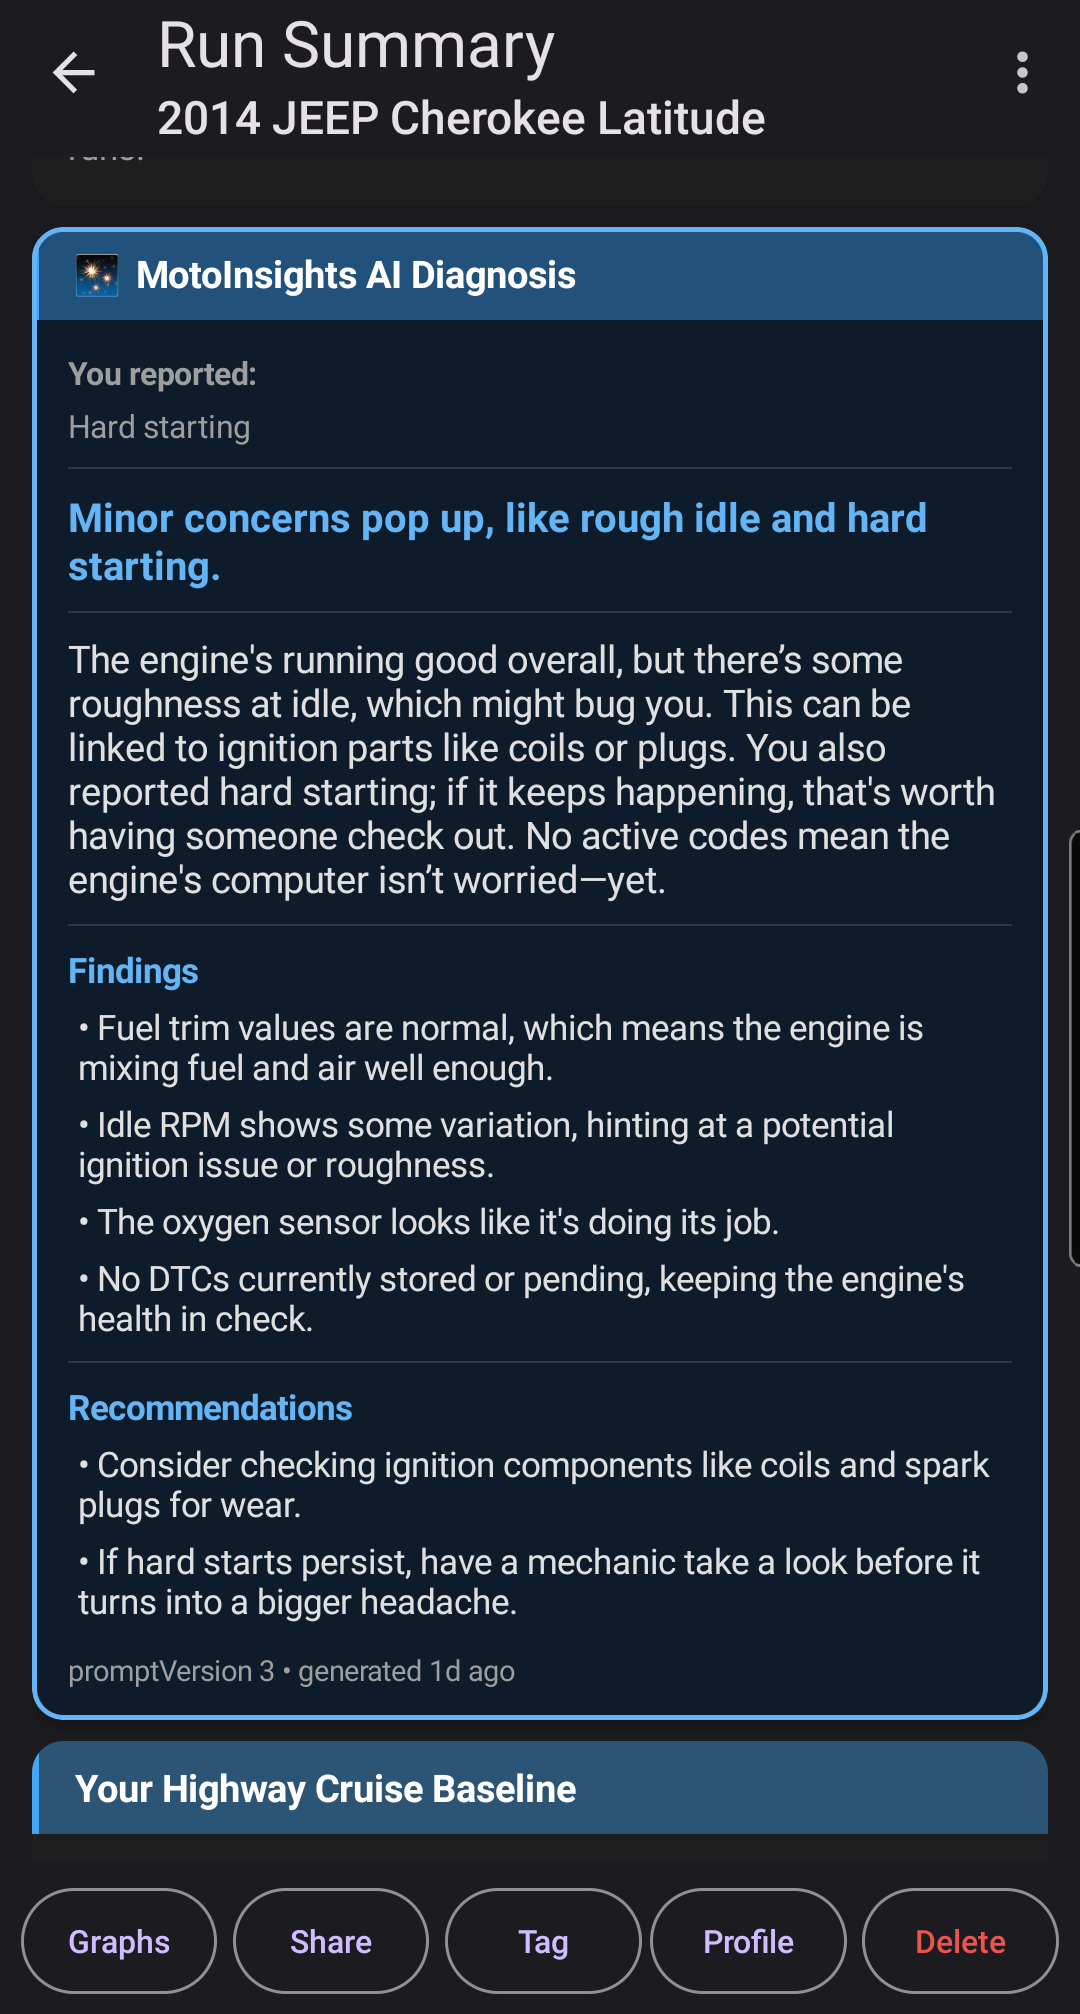
Tap one button and the app sends your run's evidence — features, fuel trims, O2 behavior, trend flags, your own symptom notes — to a cloud AI that returns a technician-style narrative with plain-English findings and actionable DIY next steps. Answers are cached per run, so re-opening is free. Two lifetime trials included.
Explainable Diagnosis
Every result shows the evidence that led to it — which sensors, which thresholds, which hypotheses were ruled in or out. No mystery meat.
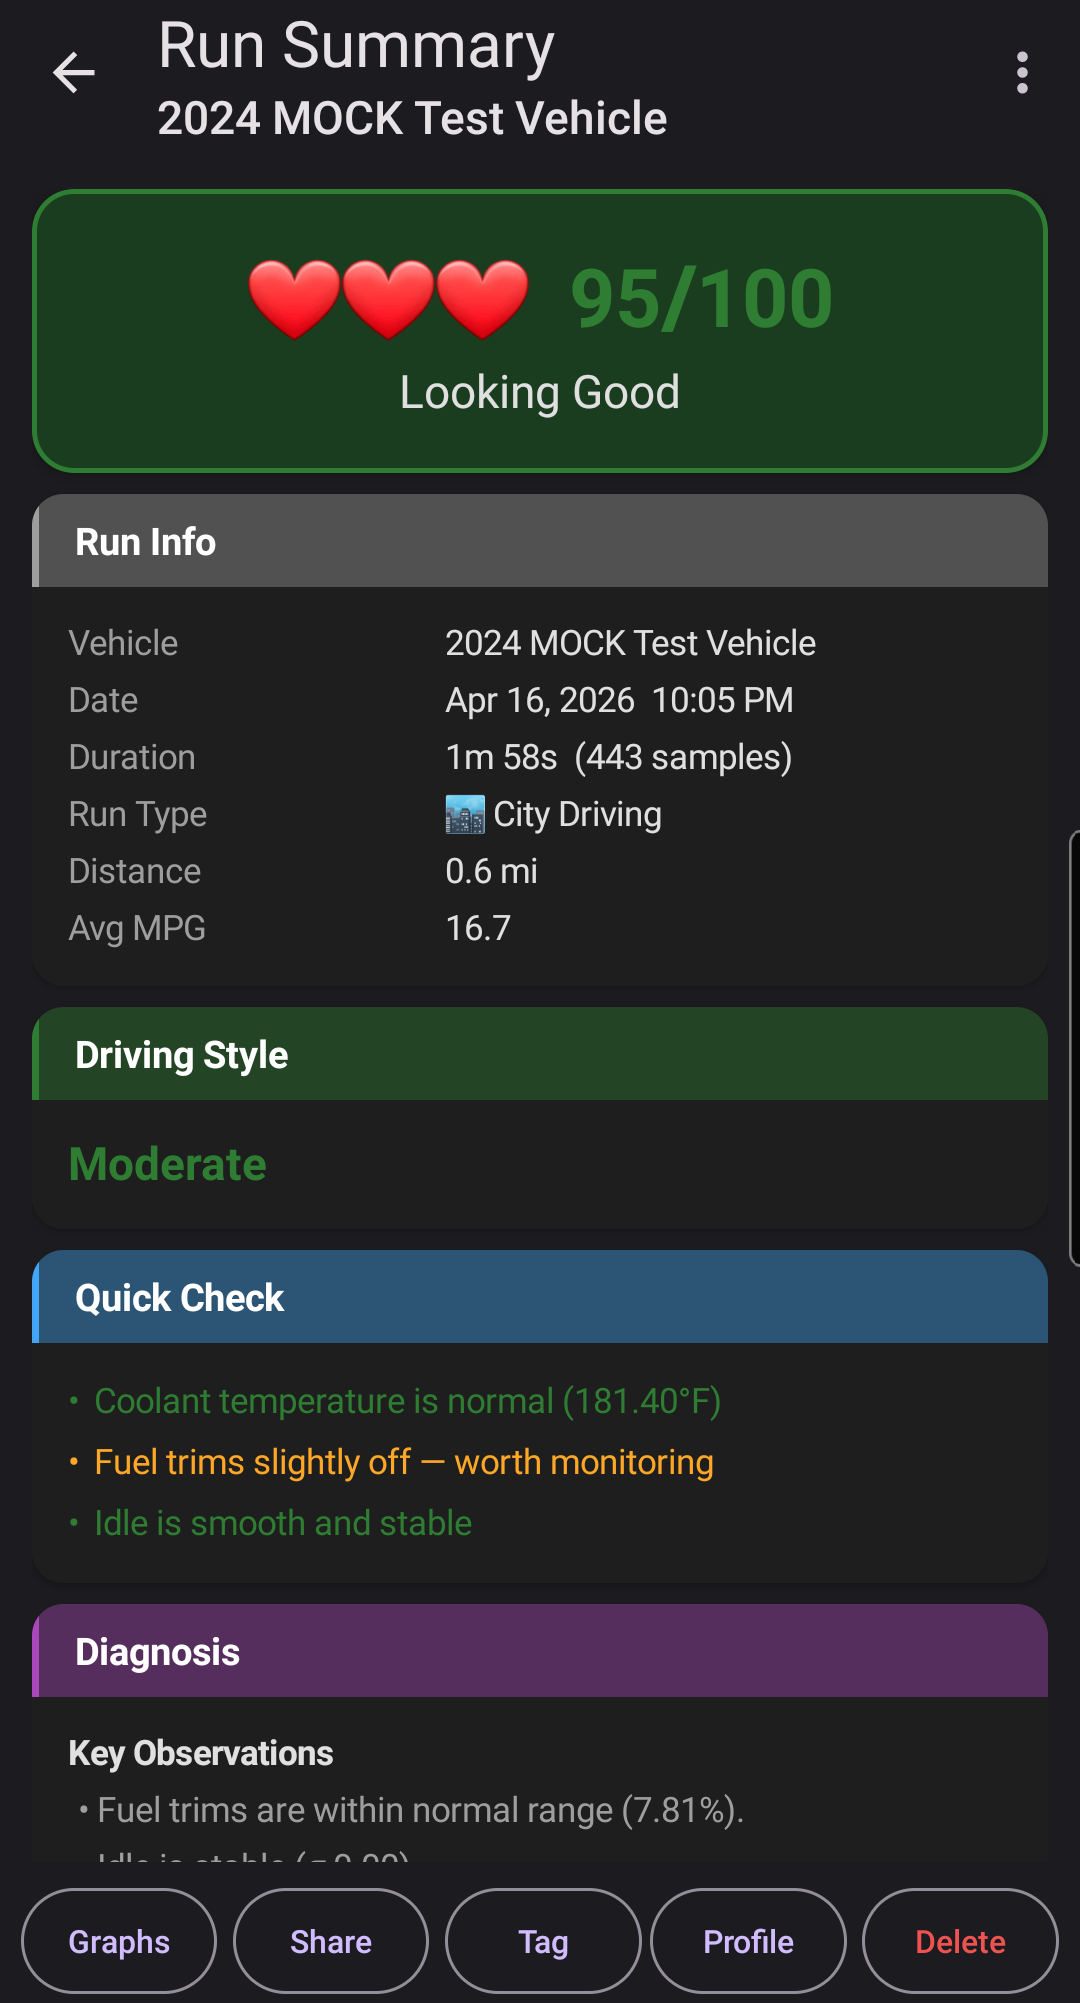
Drive & Health Score ♥♥♥
A single 0–100 number summarizing vehicle health after every run. The Run Summary opens with a color-coded hero card — green/yellow/red with a health emoji — followed by a breakdown of what's helping and what's hurting, plus a delta against your personal baseline.
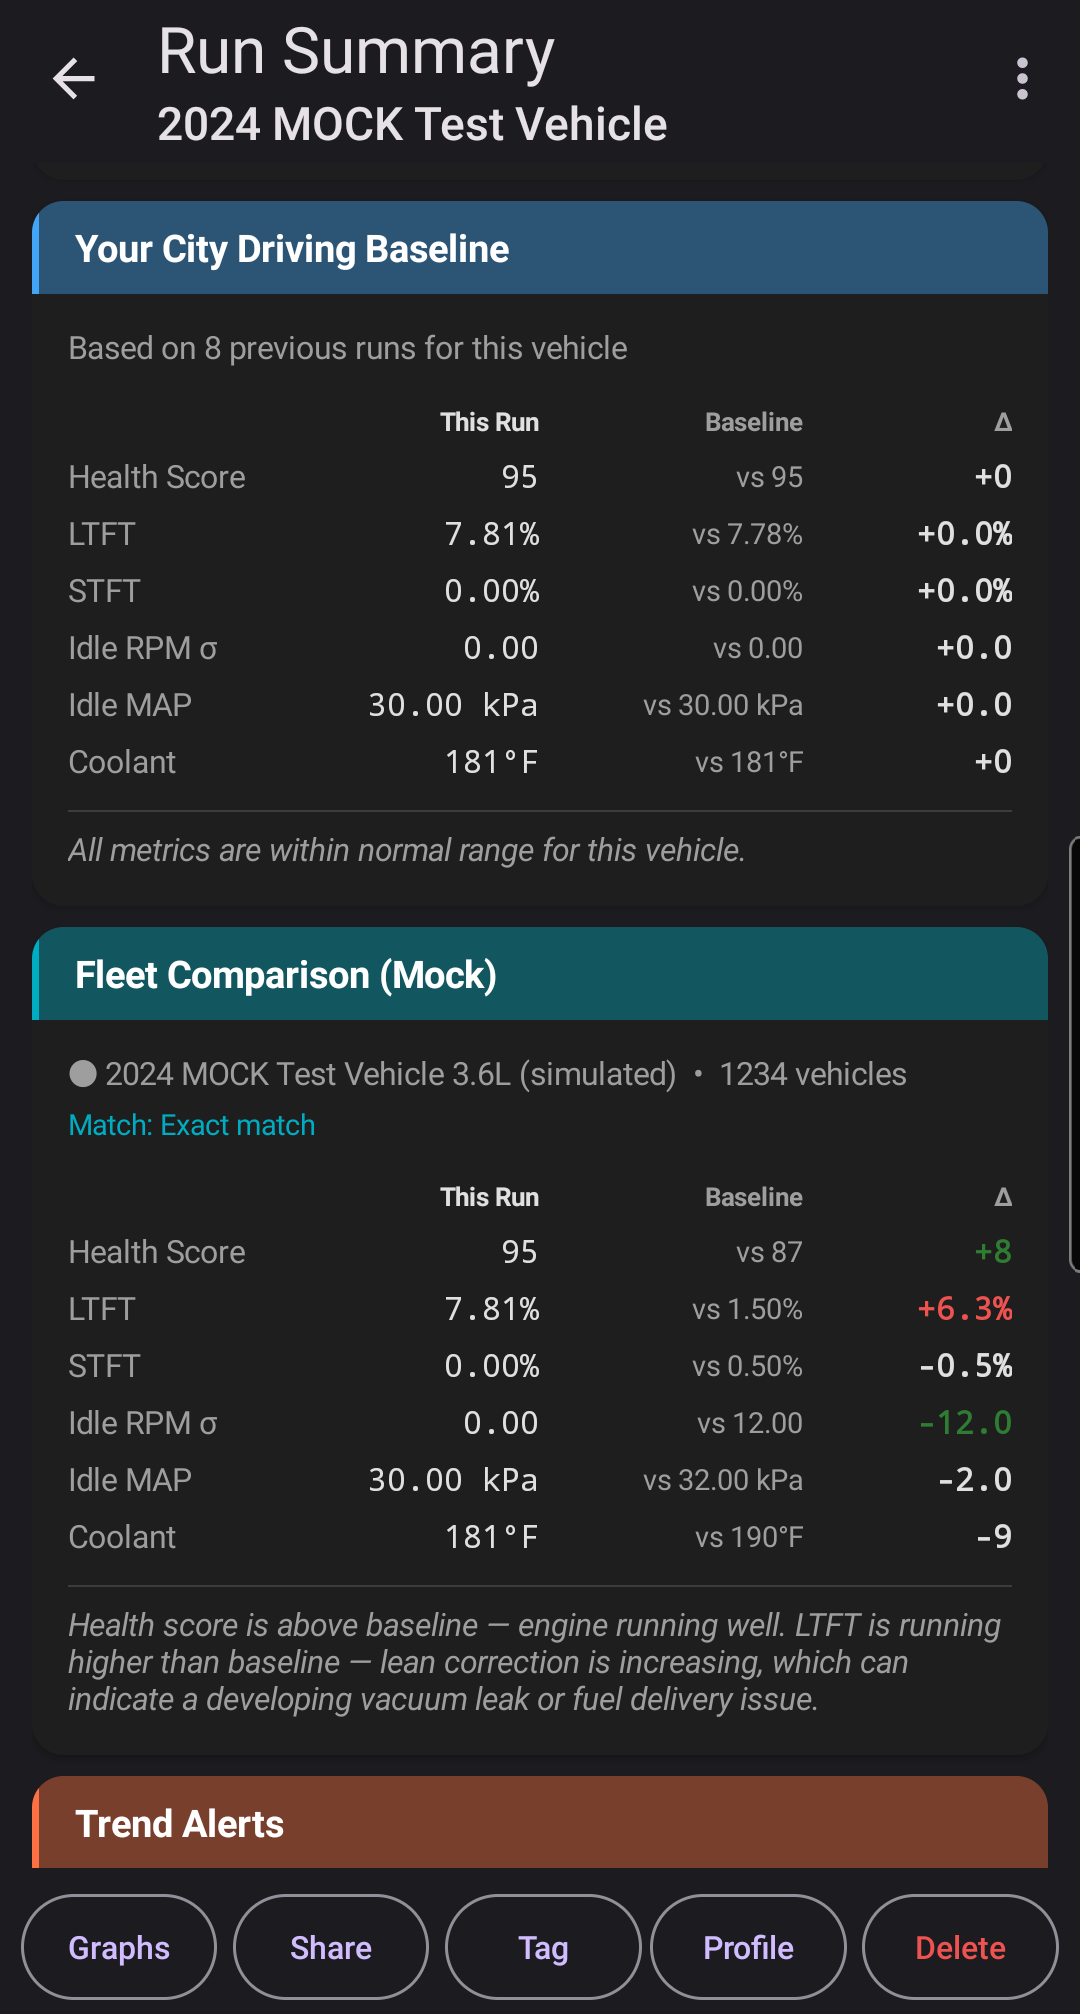
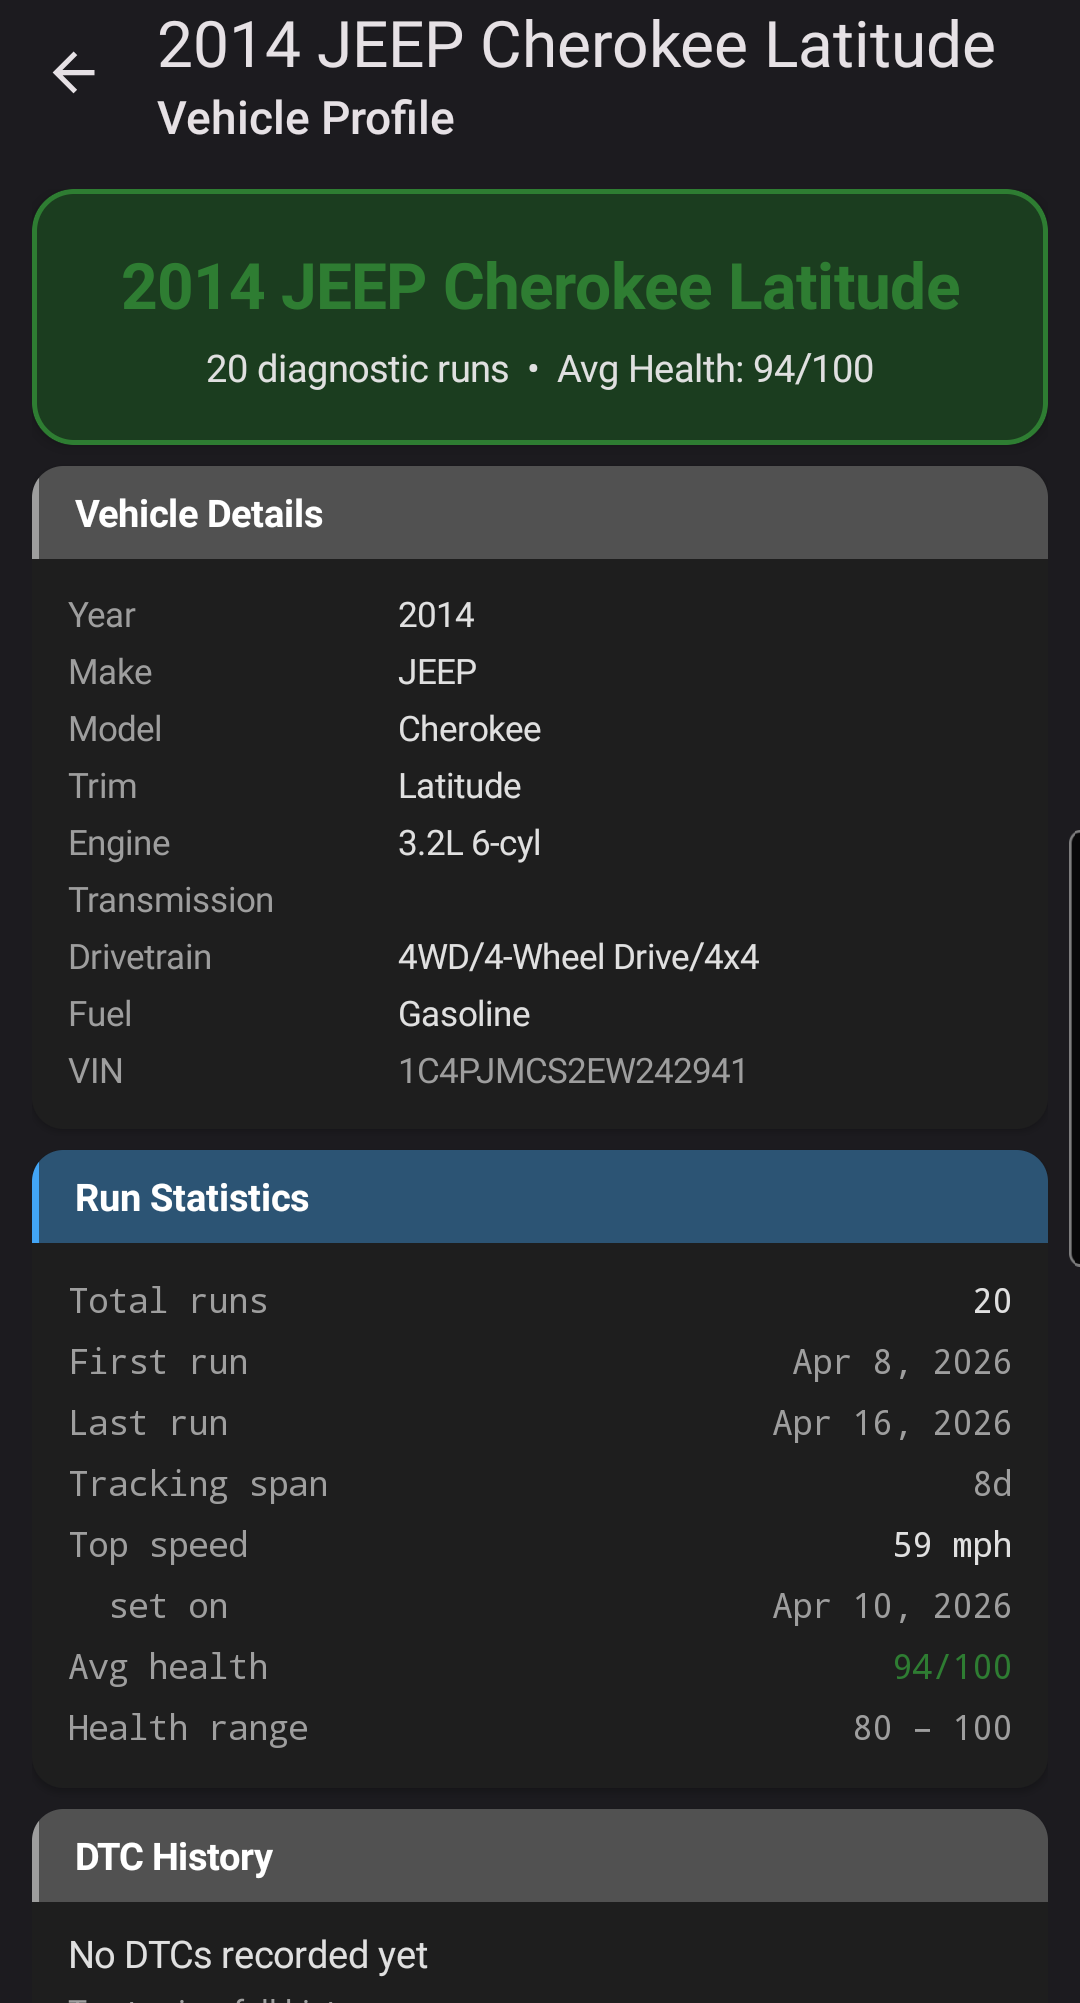
Vehicle Profiles & Baselines Pro
The app learns what's normal for your car. After a few runs it builds a personal baseline — means, ranges, and standard deviations — so every future drive is compared against your vehicle's own history.
Predictive Trend Alerts Pro
Run-over-run regression spots drift before a trouble code triggers. Fuel trims creeping lean? RPM stability declining? You'll see it coming, with severity levels and a sparkline of recent values.
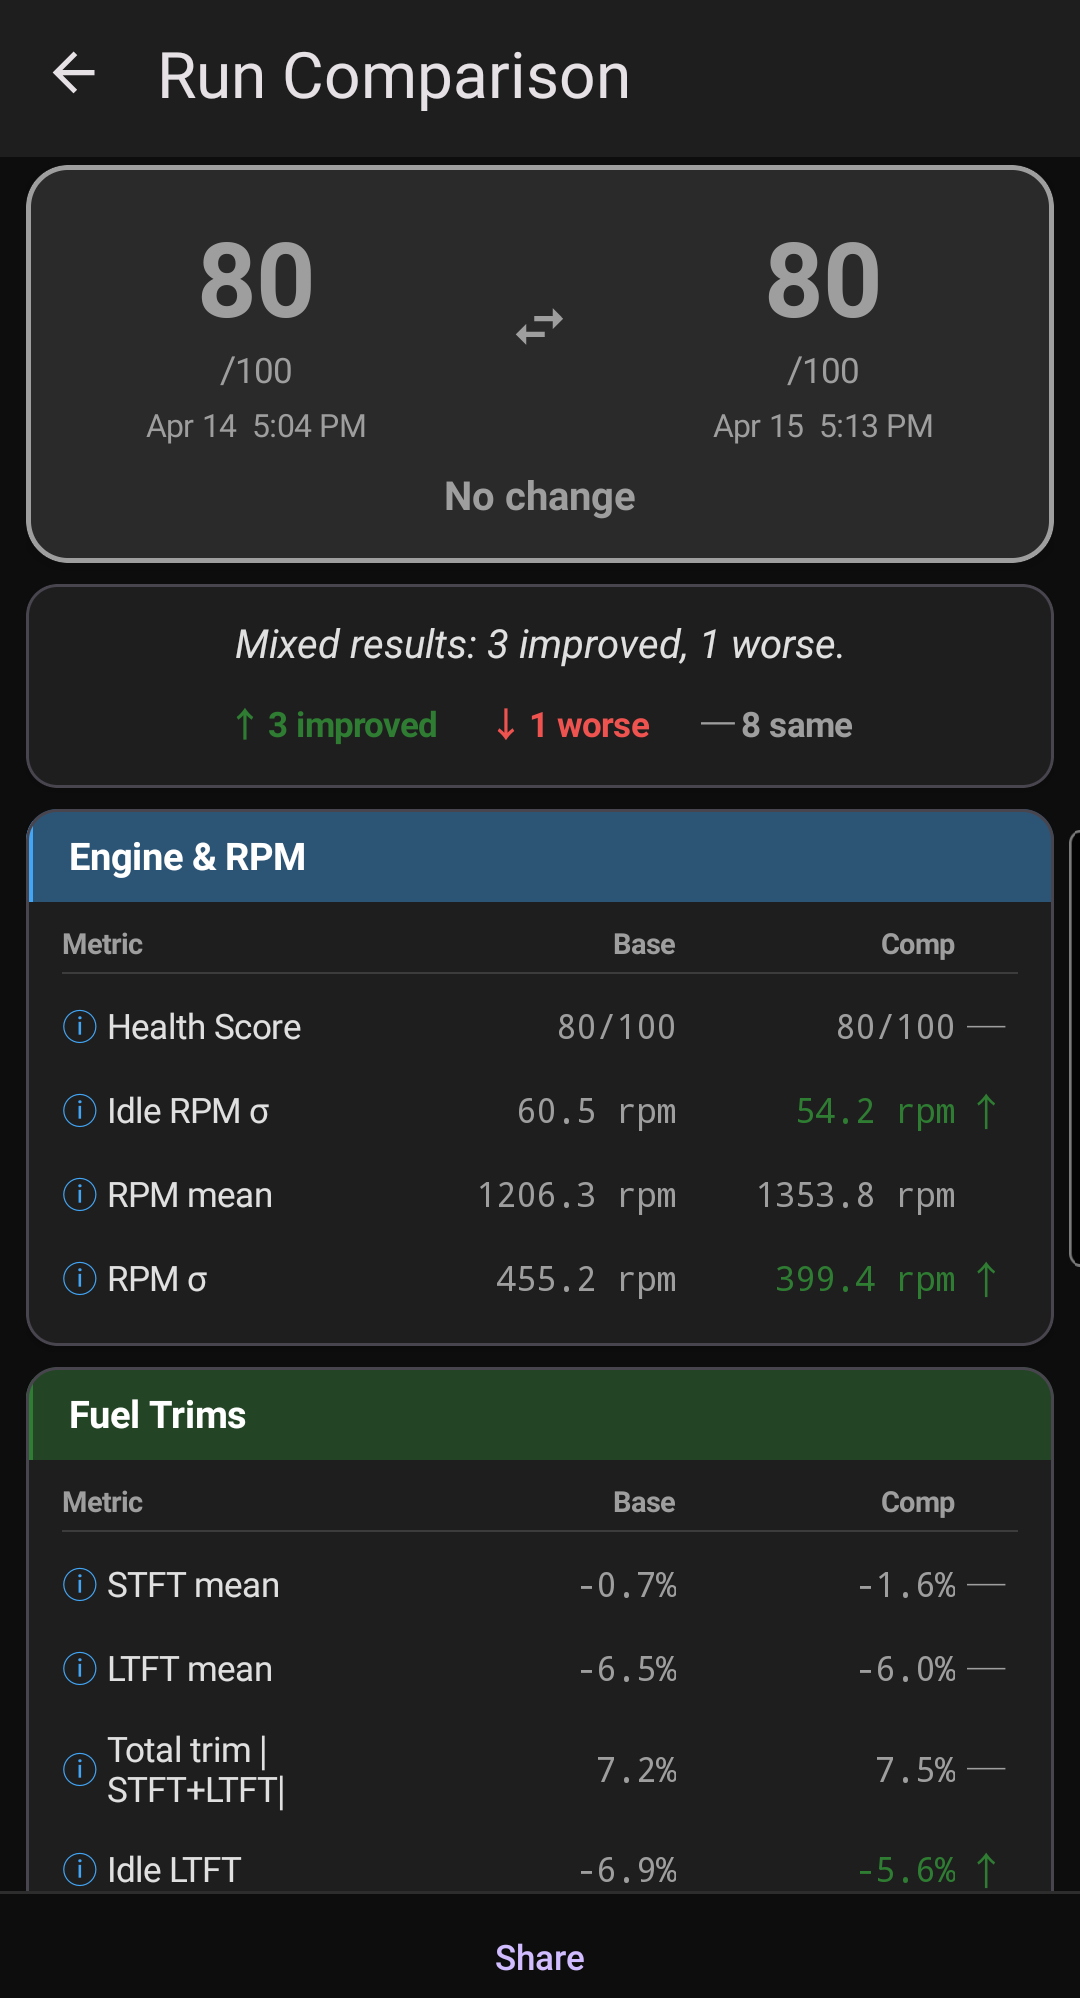
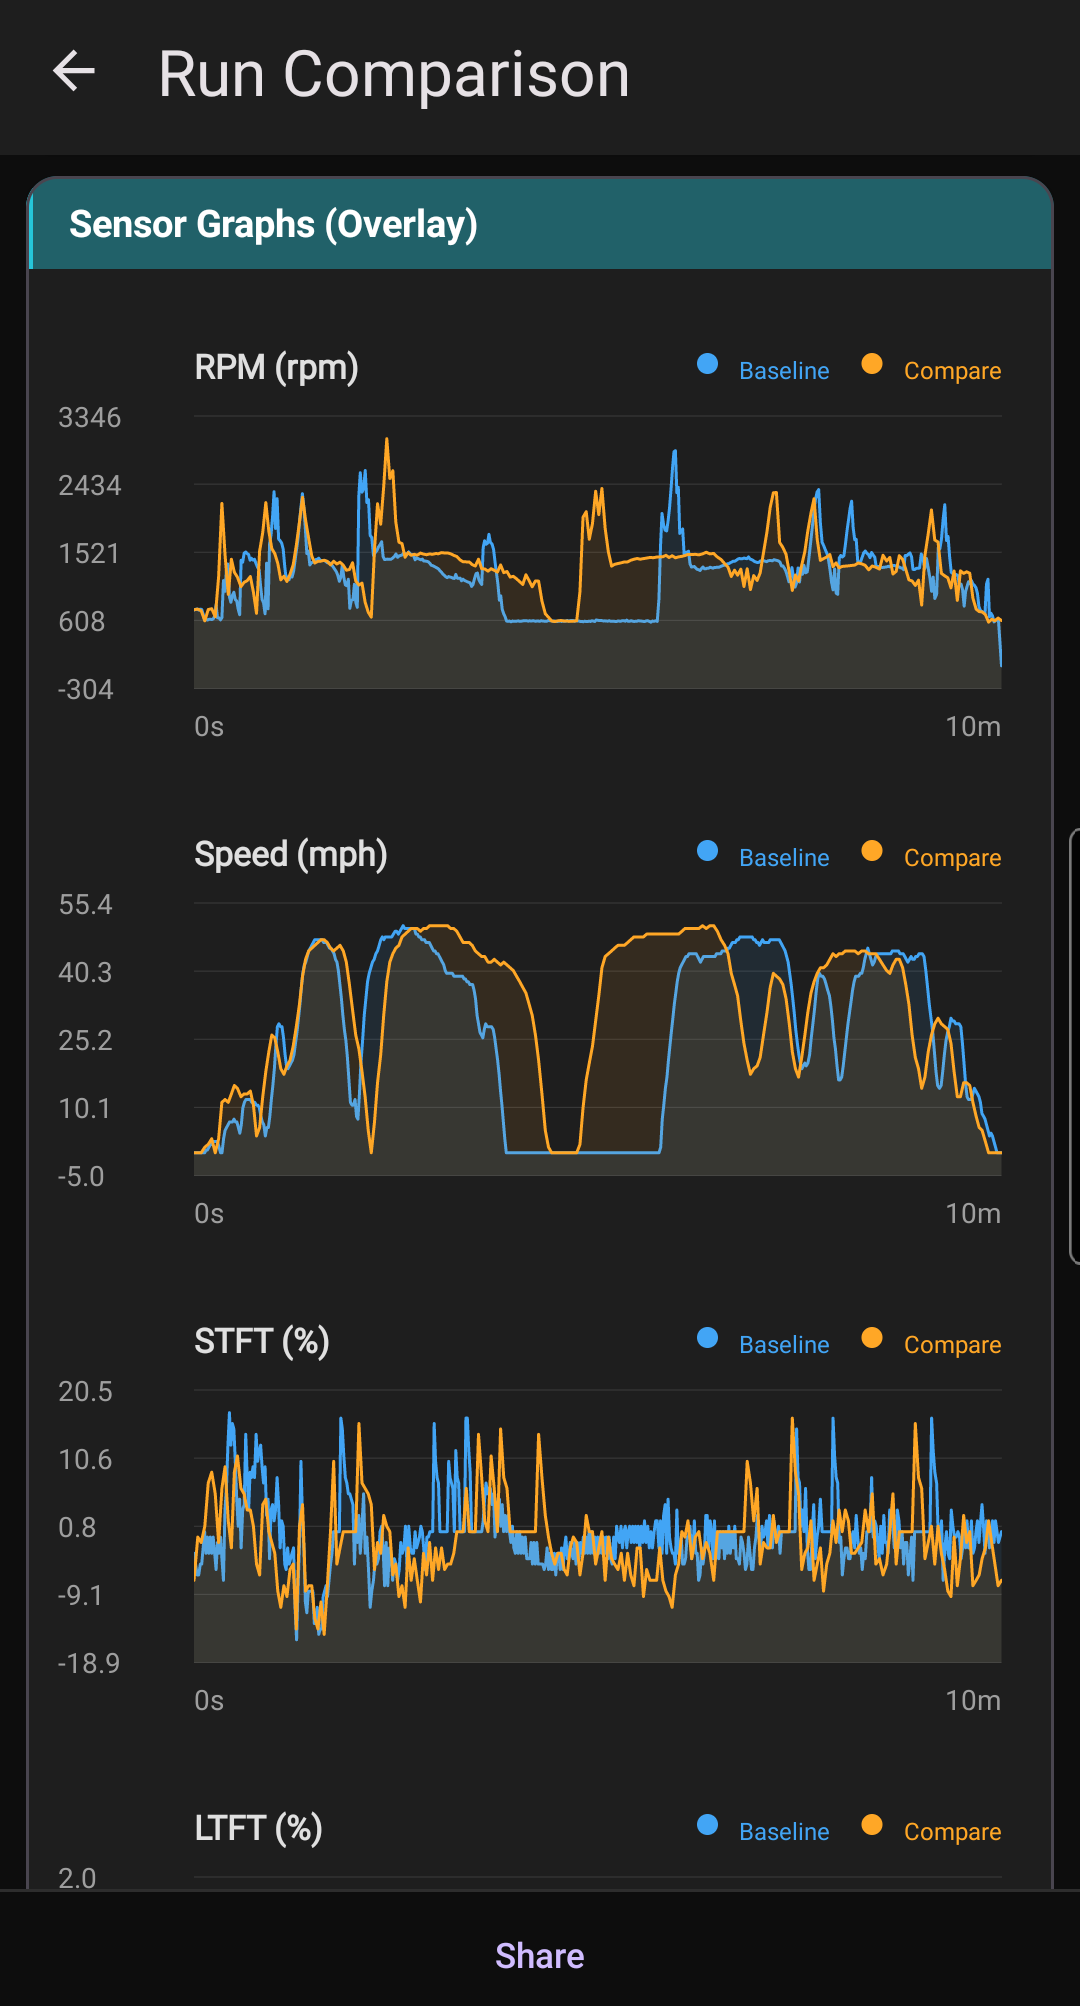
Run Comparison & Fix Verification
Compare any two runs side-by-side across 20+ metrics with verdicts for each sensor. After a repair, see proof the fix actually worked. Pro unlocks dual-trace overlay graphs so you can see exactly where the trace changed.
Share With Your Mechanic
Export any run summary as a plain-text message or a one-page branded PDF report — health score, diagnosis, evidence, DTCs, and baselines included. Send it to your shop before you drop the car off, and they'll already know what the app saw.
Fleet Intelligence Opt-in
Compare your vehicle against the anonymized fleet — other owners of the same year, make, model, and engine. Answer the #1 DIY question: "Is this normal for my car?"
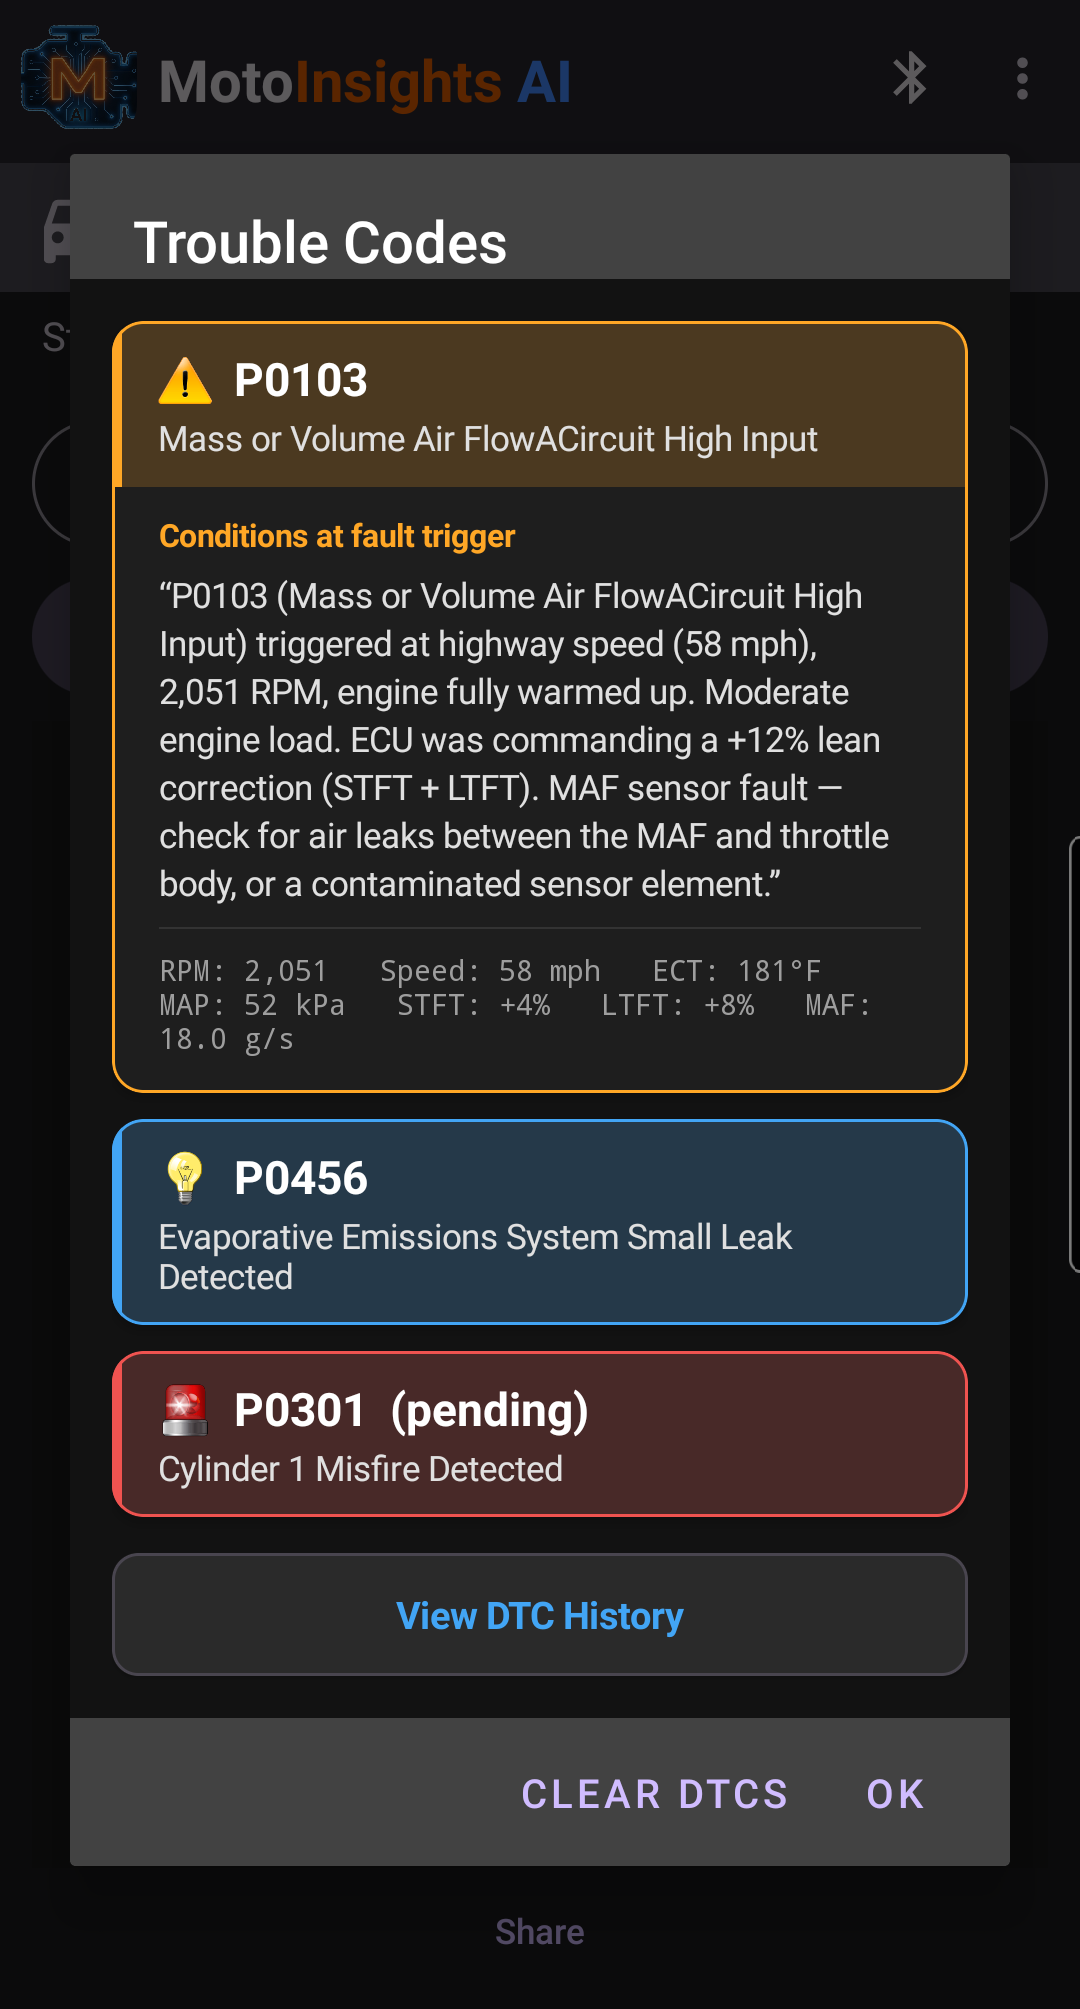
Smart DTC Reader
Read and clear trouble codes with automatic severity classification (critical, moderate, minor), history tracking, and graceful handling when the ECU refuses to clear a code.
Freeze Frame Storytelling Pro
When a code triggers, the ECU records the conditions at that moment. The app turns that data into a plain-English narrative: what the engine was doing, how warm it was, and what that implies about the fault.
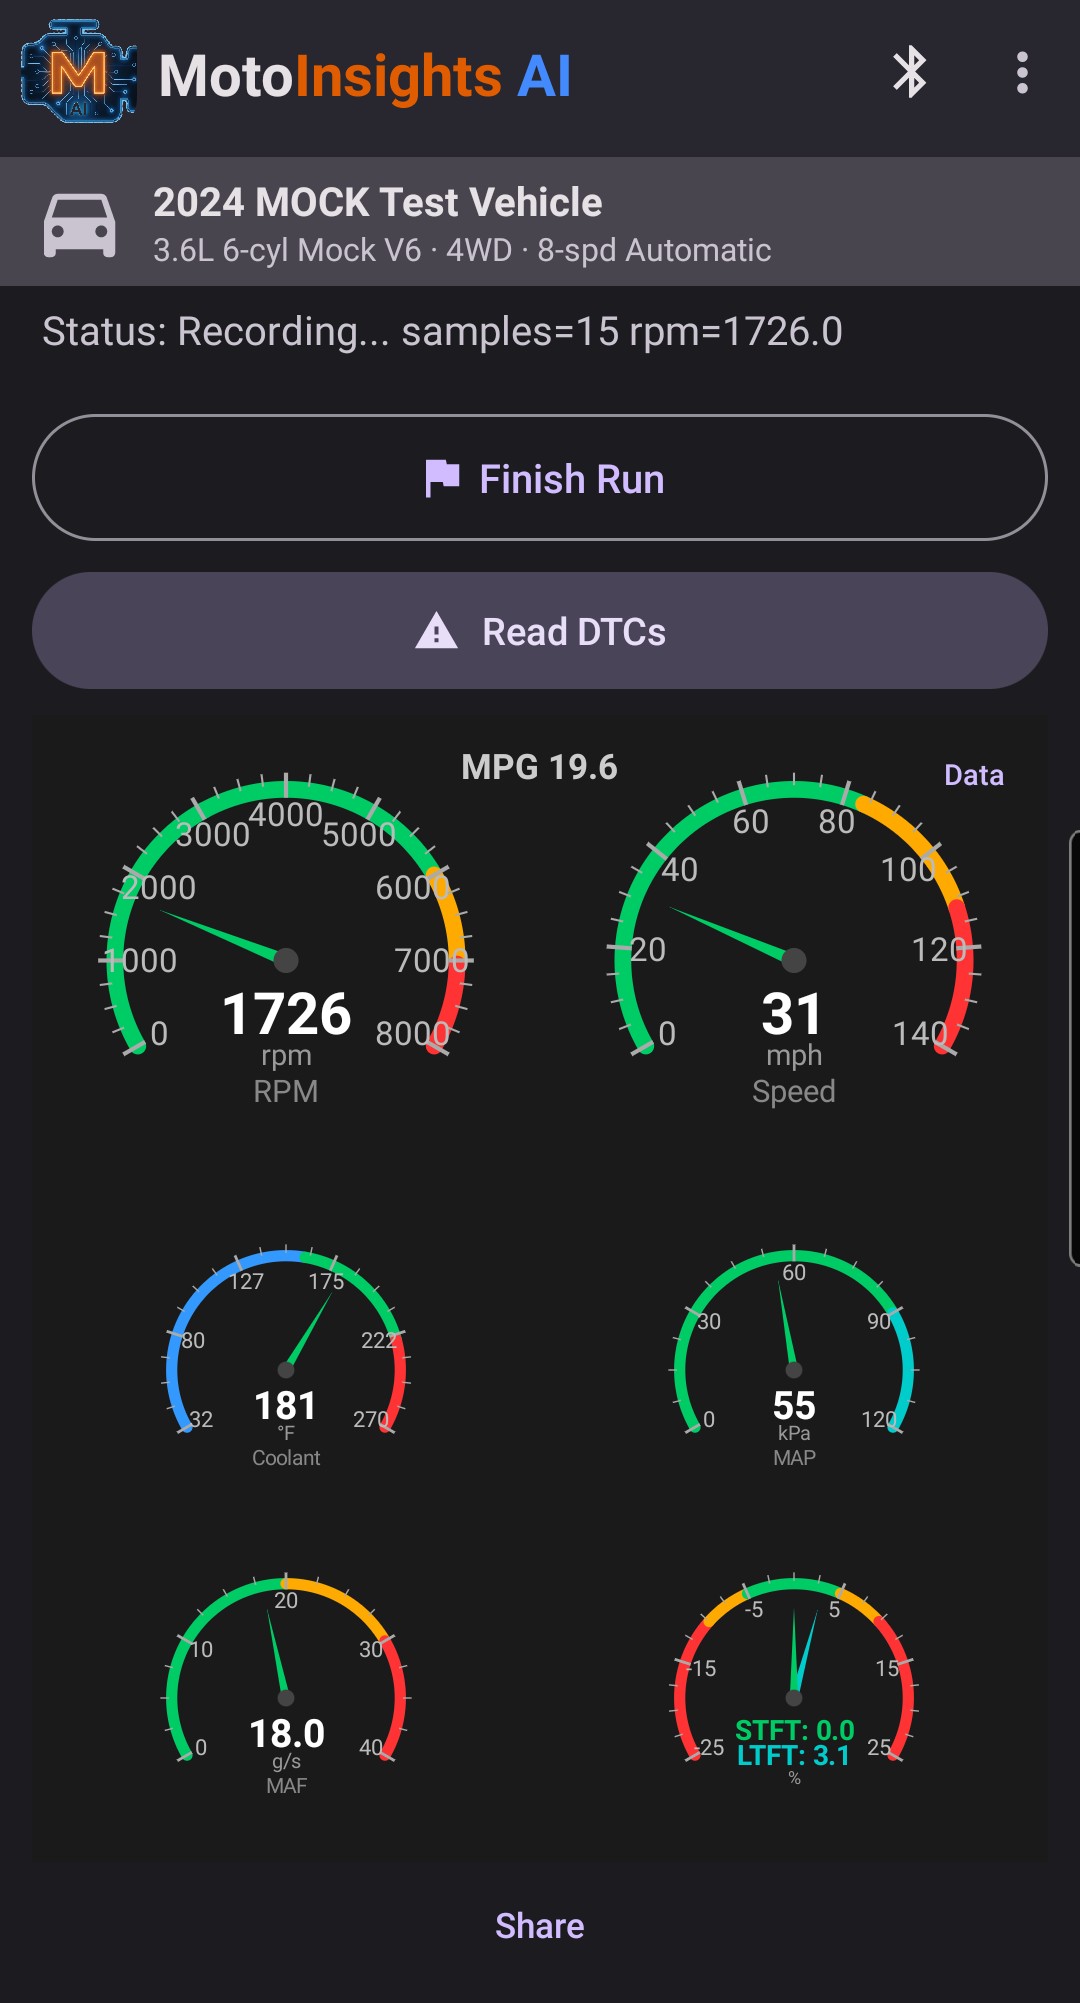
Live Sensor Graphs
Custom-rendered charts for RPM, speed, fuel trims, coolant, MAP, MAF, and O2 — with user-selectable units and a clean, readable layout.
Custom Live Graphs Pro
Build your own live dashboard. Pick up to four sensors from a catalog of 17 — plus multi-series combos like STFT+LTFT, throttle vs. engine load, and pre/post-cat O2 — reorder them, and watch them stream in real time. Rolling windows from 15 seconds to 5 minutes and scale-aware Y-axes keep the data readable no matter what you're chasing.
Drive Type Awareness
Runs are automatically classified — cold idle, warm idle, city, highway, mixed, or short — so comparisons and baselines are always apples-to-apples, never mixing a highway cruise with a cold start.
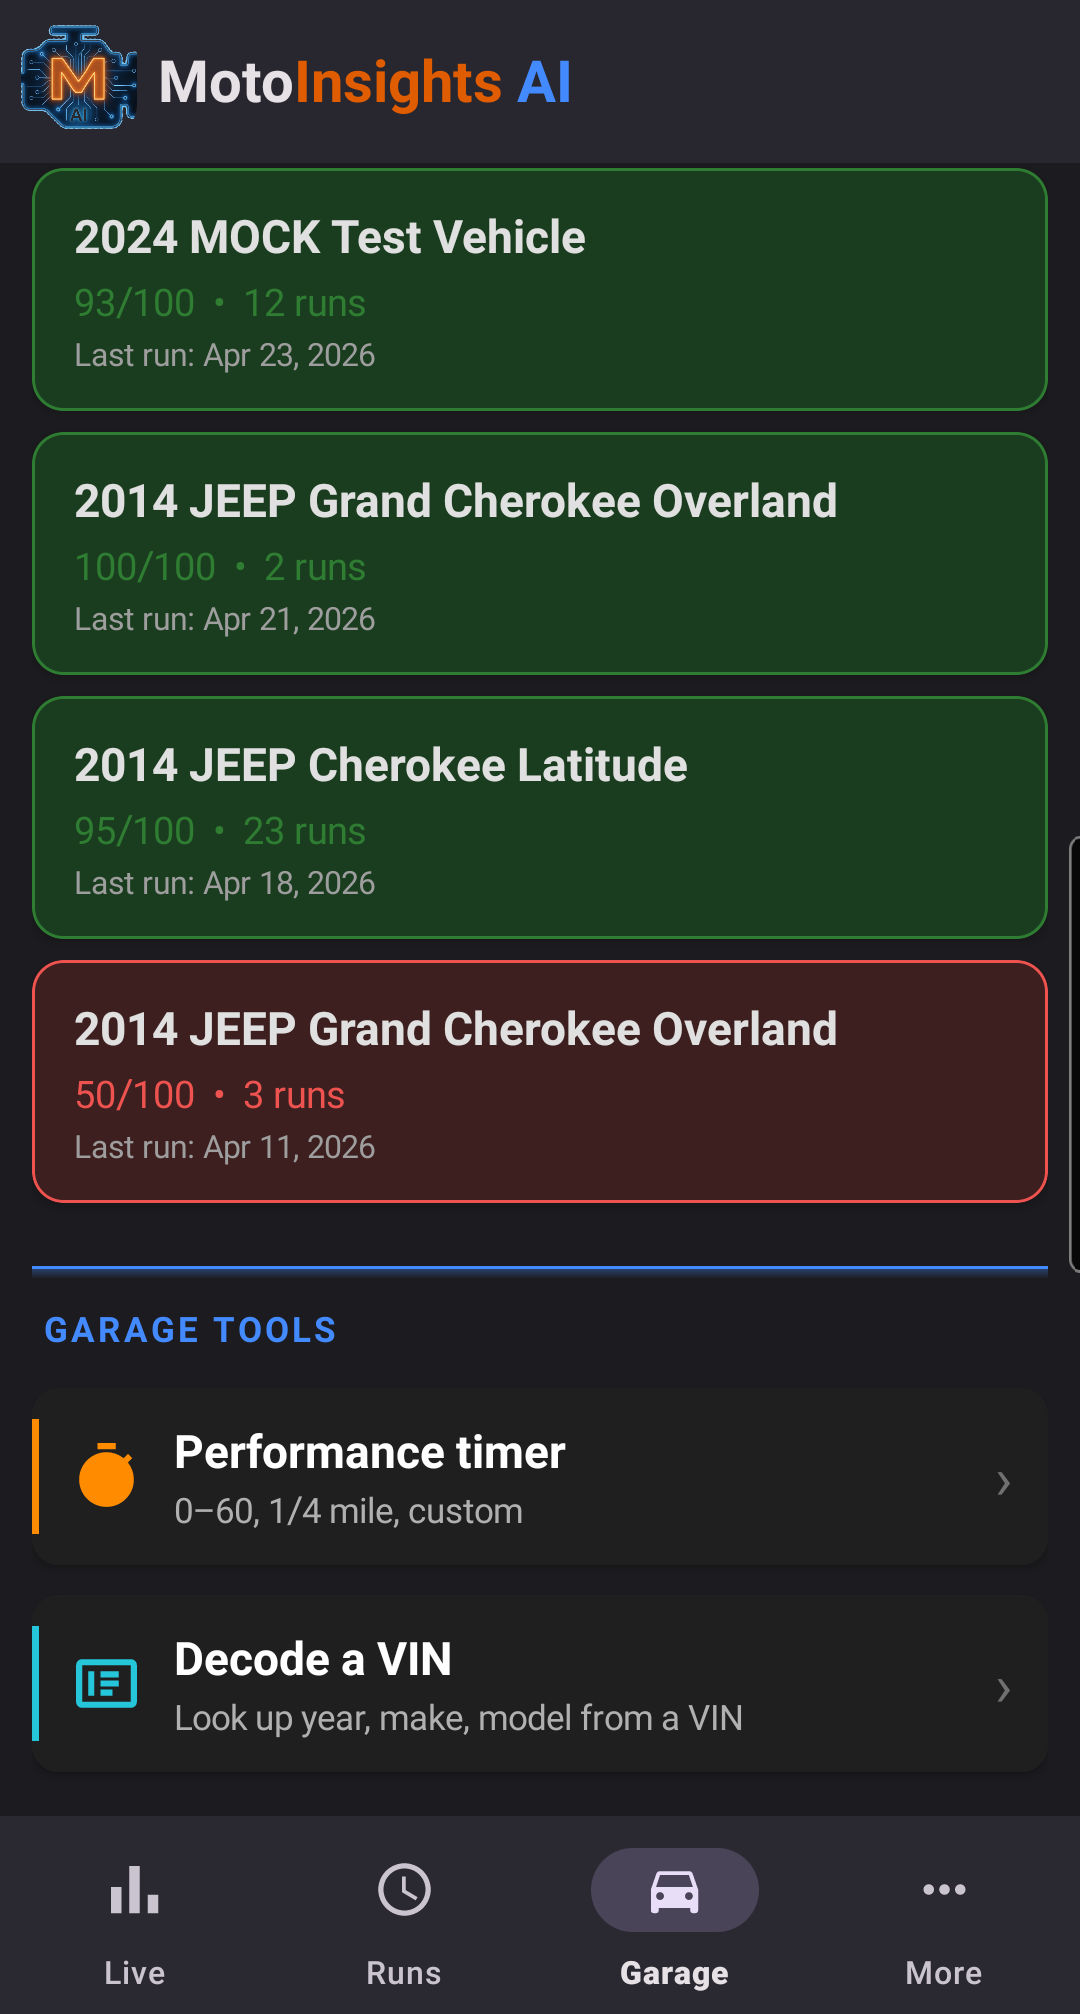
Multi-Vehicle Ready Pro
Every vehicle gets its own profile, keyed by VIN and auto-populated from NHTSA data. Track the family fleet without the data bleeding between cars.
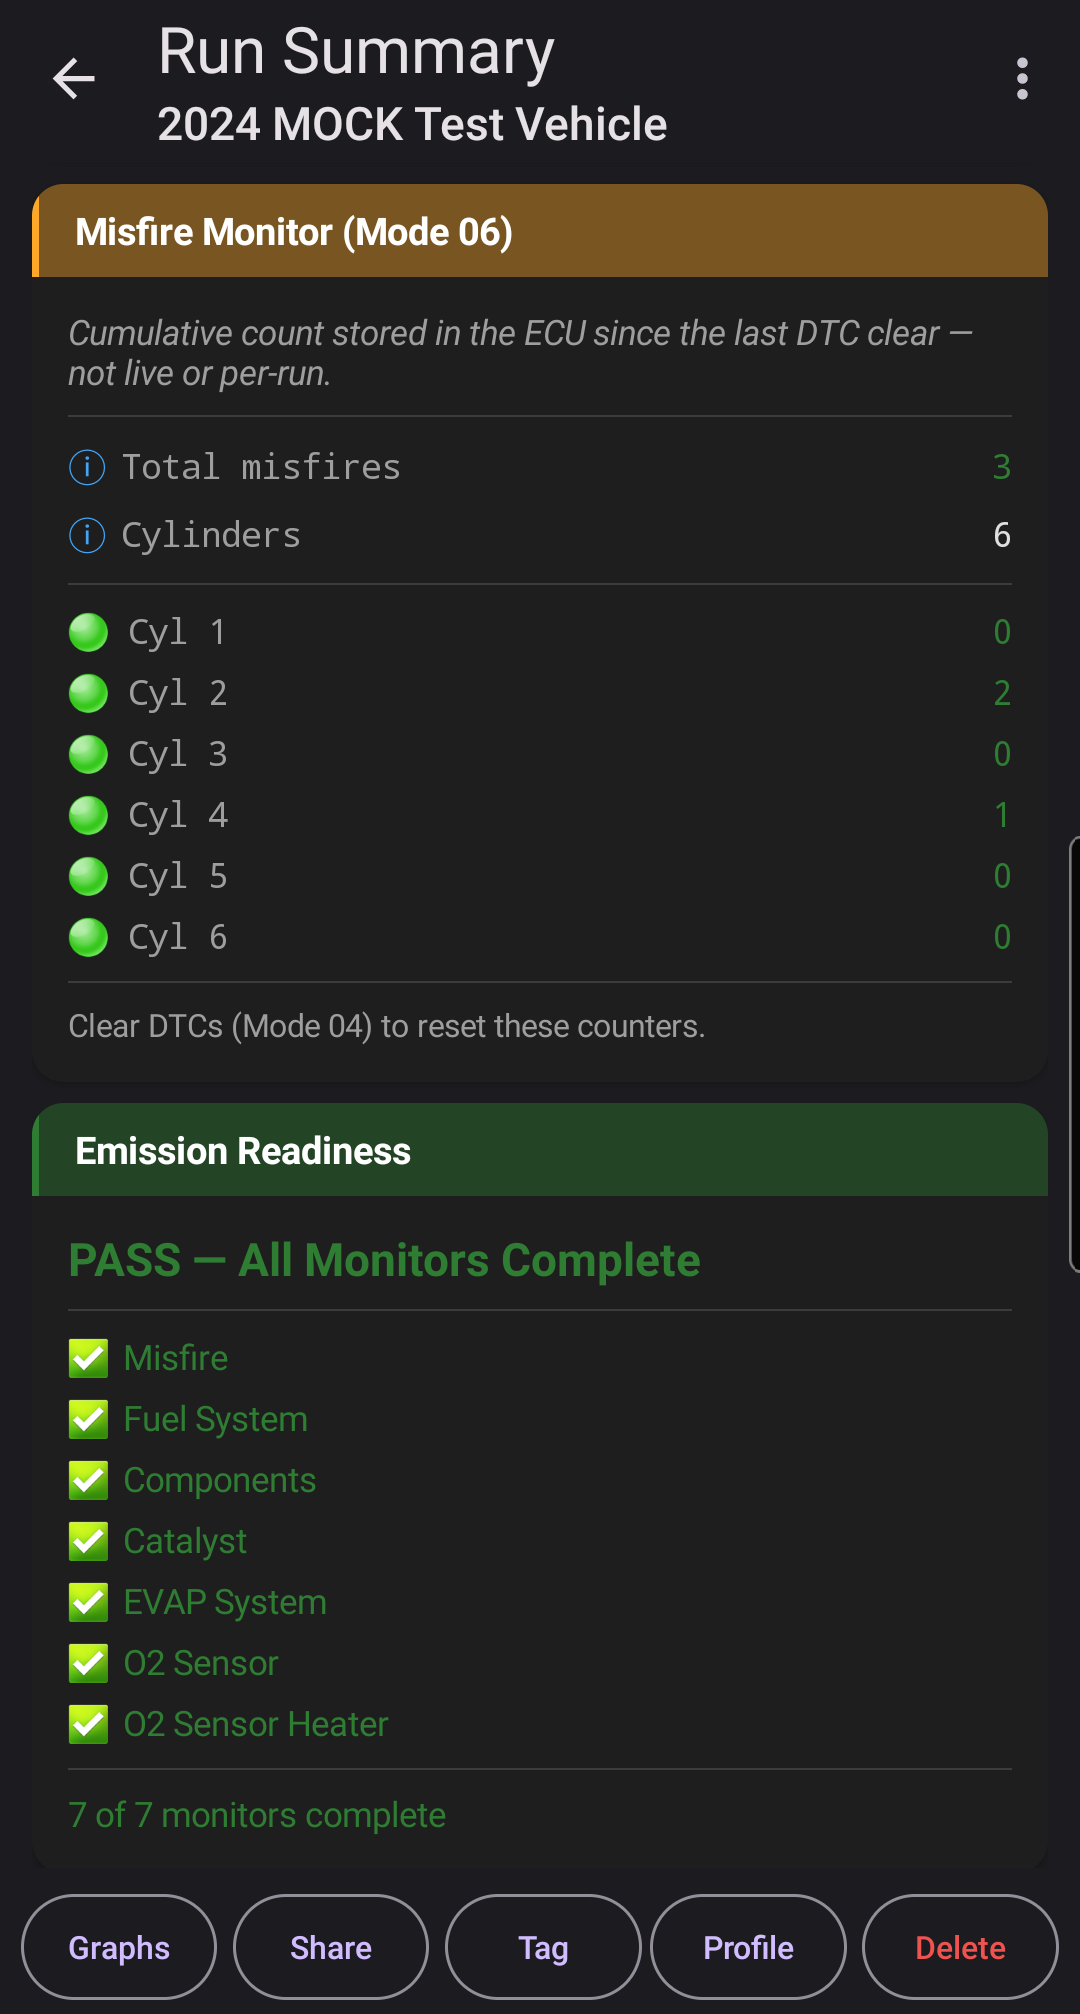
Emissions Readiness
See which OBD-II emission monitors have run and passed — catalyst, O2 sensors, EVAP, EGR, and more — with a clear pass/not-ready verdict before your next inspection.
Driving Style Analysis
The app watches how you drive — firm accelerations, peak RPM under throttle, overall aggression — and scores your style each run so you can connect driving behavior to wear, fuel economy, and long-term health trends.
Trip Distance & MPG
A live MPG indicator on the dashboard plus distance and average MPG on every run summary — calculated from MAF or fuel-rate PIDs so the numbers come from your car, not a guess.
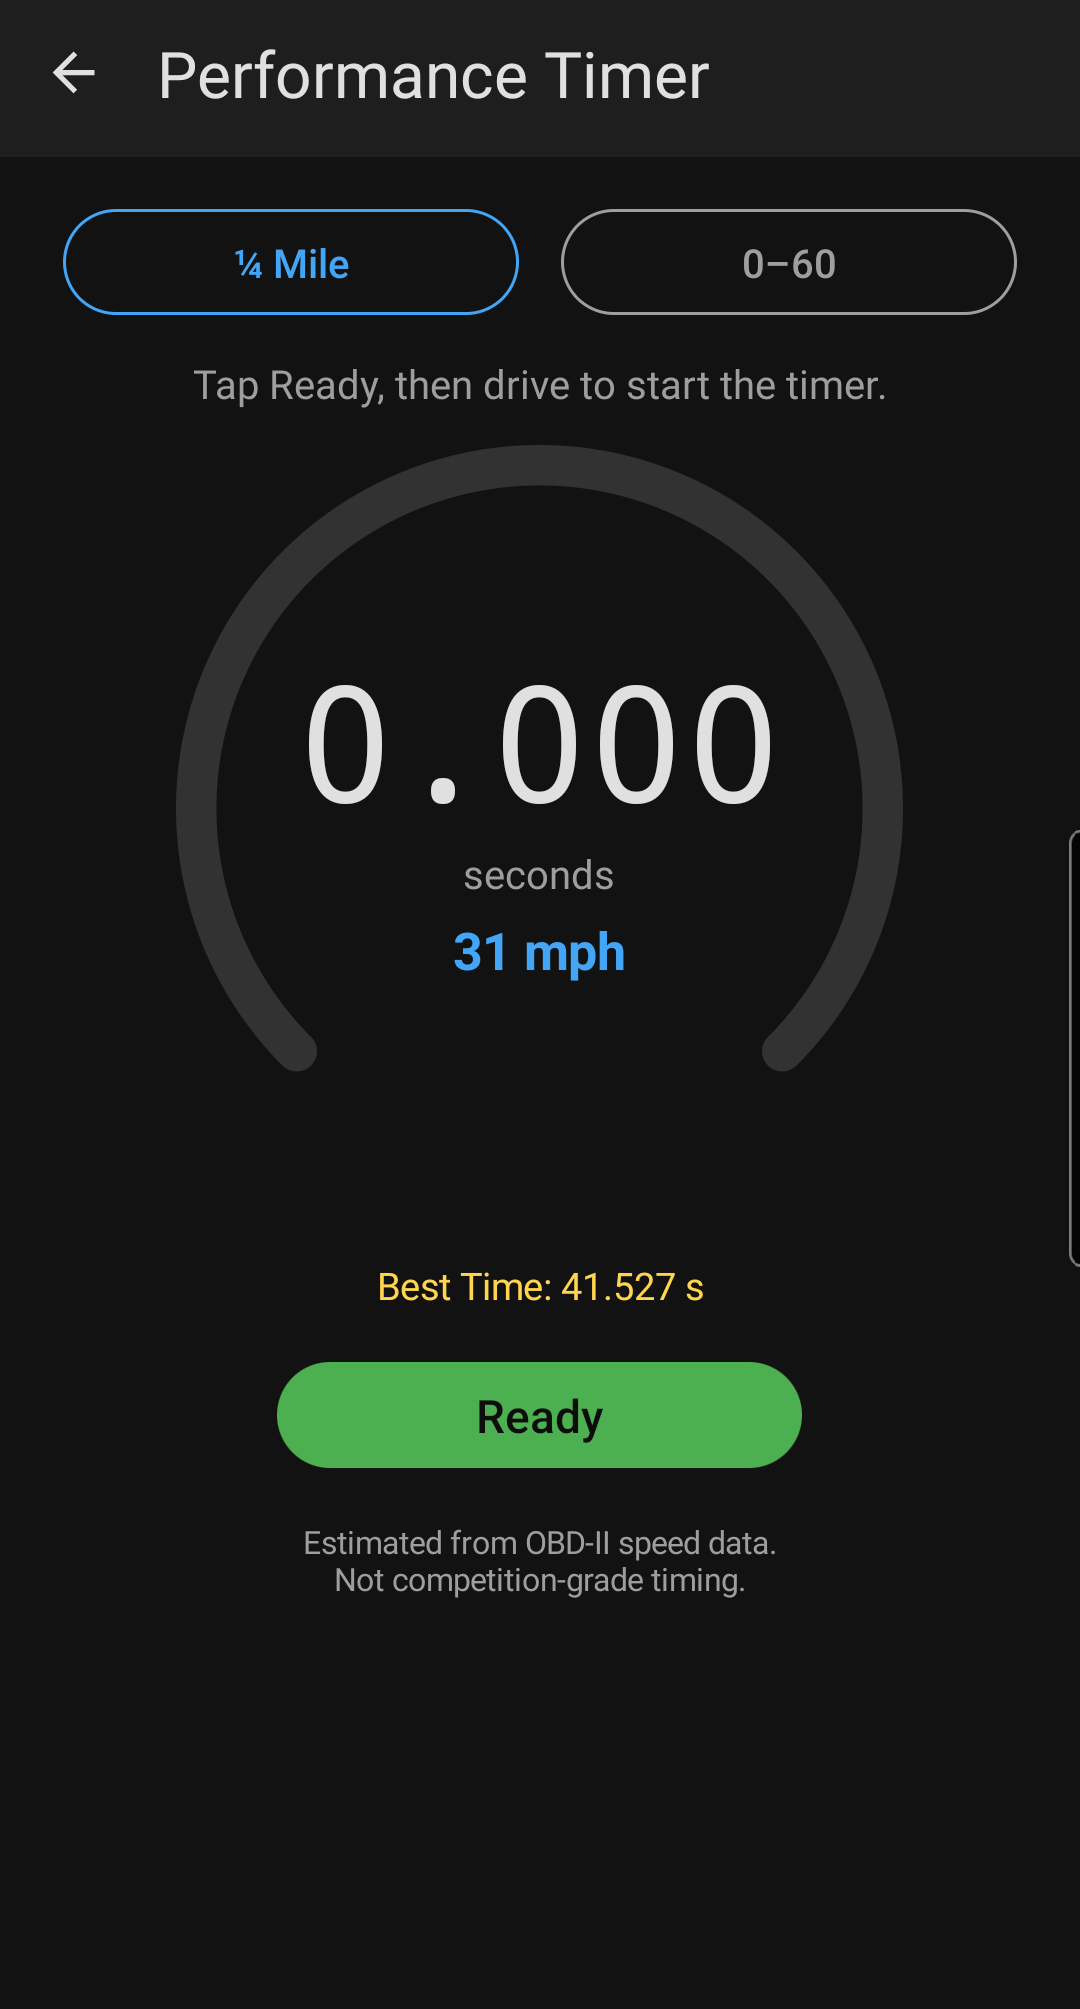
Performance Timer
Built-in 0–60 mph and quarter-mile timer in the Garage Tools menu, using OBD-II speed for distance and elapsed time. Clean stoplight-to-stoplight runs, no stopwatch required.
Offline-First & Private
Diagnostic reasoning runs entirely on your device. No account, no ads, no profiling. Your data stays yours — see the privacy policy.
Free vs Pro
Same app. Free covers reading, scoring, and sharing. Pro adds the diagnostic reasoning depth.
| Feature | Free | Pro |
|---|---|---|
| Reading & sharing | ||
| Read & clear trouble codes | ✓ | ✓ |
| Health Score + Quick Check | ✓ | ✓ |
| Run Comparison (any two runs) | ✓ | ✓ |
| Share with mechanic (text + PDF) | ✓ | ✓ |
| Performance Timer (0–60, ¼ mile) | ✓ | ✓ |
| Emissions readiness | ✓ | ✓ |
| Live data | ||
| Live Sensor Graphs (6 fixed slots) | ✓ | ✓ |
| Driving Style Analysis | ✓ | ✓ |
| Custom Live Graphs (up to 4, your pick) | — | ✓ |
| Diagnostic reasoning | ||
| AI Deep Diagnosis (cloud, unlimited) | 2 free trials | ✓ |
| Probabilistic reasoning + evidence chains | — | ✓ |
| Freeze frame storytelling | — | ✓ |
| Comparison overlay graphs | — | ✓ |
| Baseline comparison & trend alerts | — | ✓ |
| Historical health charts | — | ✓ |
| Multi-vehicle profiles | 1 vehicle | ✓ |
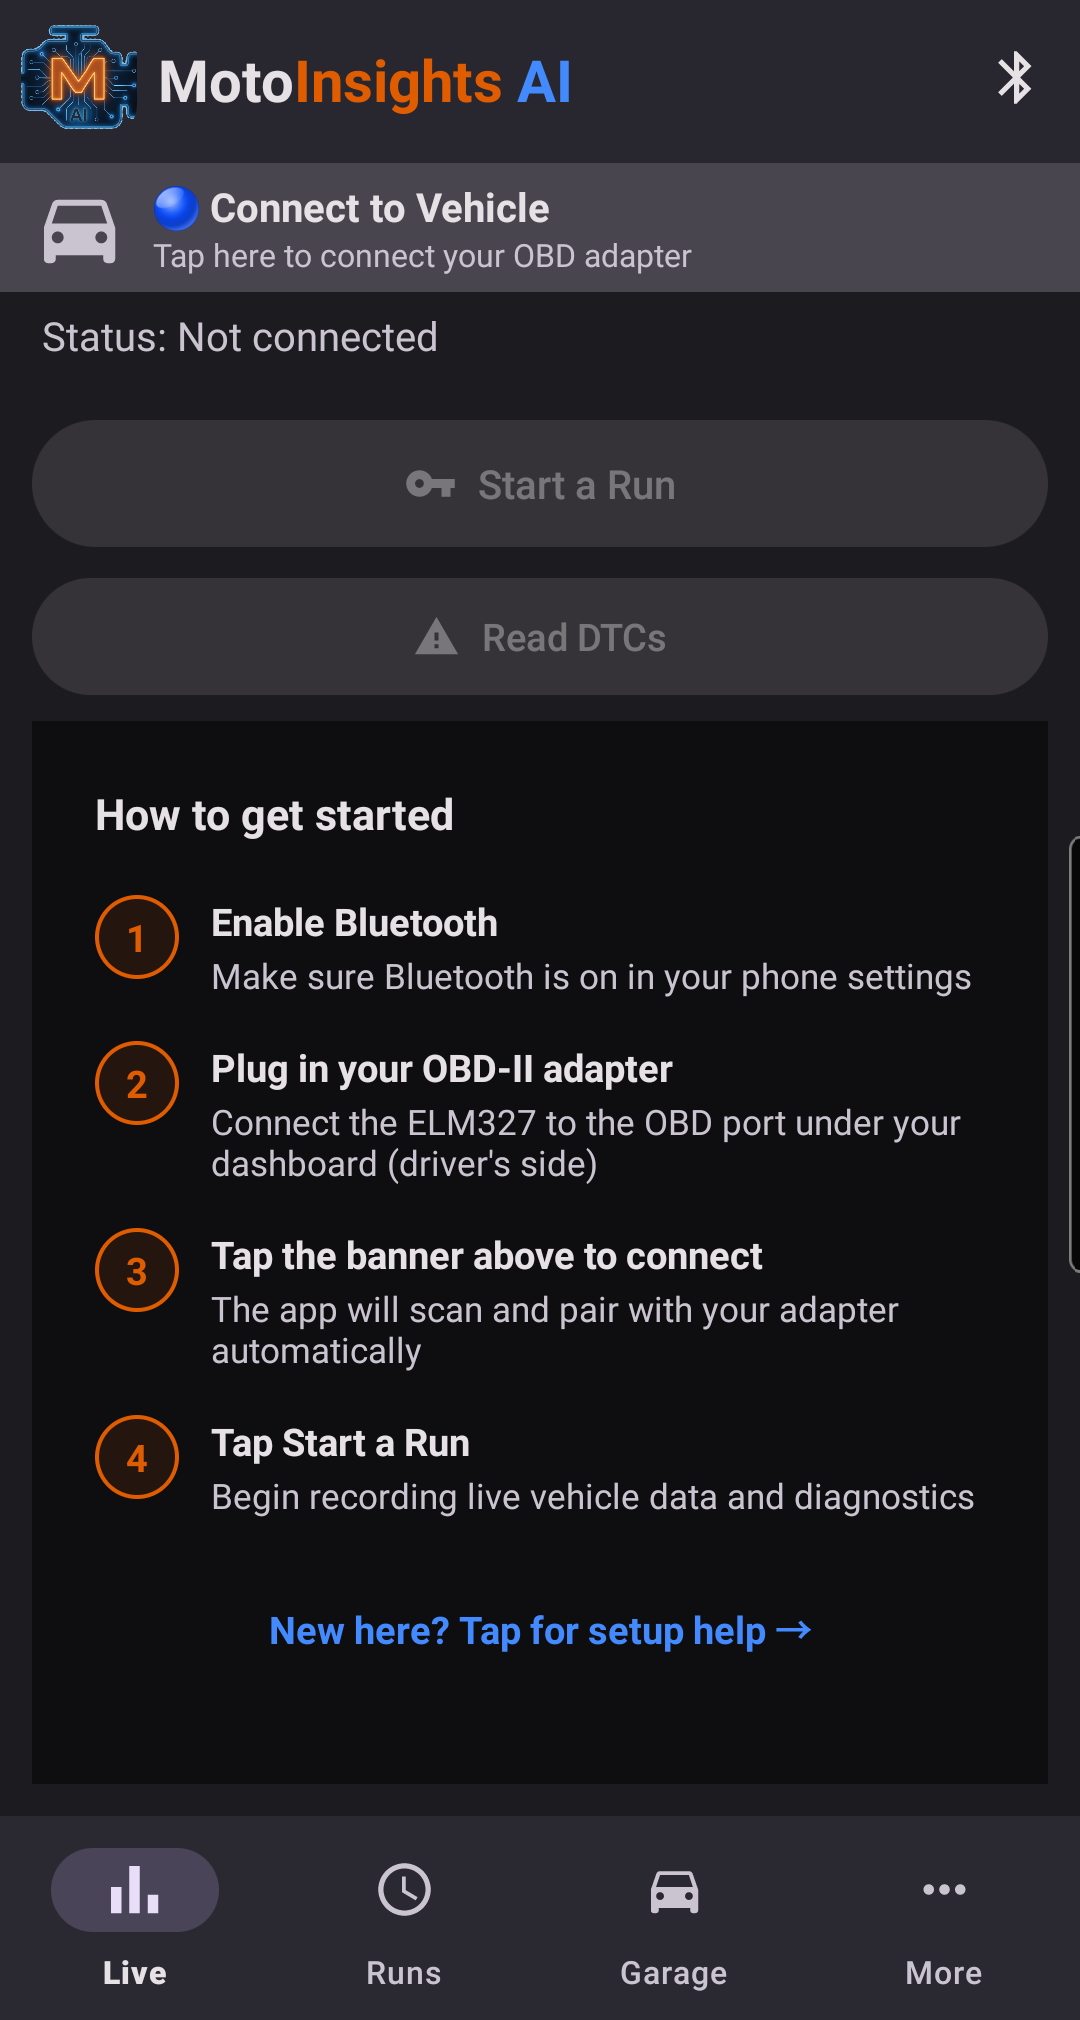
How It Works
From adapter to insight in four steps.
Plug In
Connect a Bluetooth Low Energy (BLE) OBD-II adapter — e.g. Veepeak BLE+ — to your OBD-II port. Classic Bluetooth ELM327 adapters are not supported.
Pair
Open MotoInsights AI. The app pairs over BLE and auto-identifies your vehicle from its VIN.
Record a Drive
Tap Record Drive. Go about your day — idle, city, highway. The app captures everything it needs.
Read the Story
Stop the run and get your health score, diagnosis cards, trend alerts, and baseline comparisons.
Screenshots
A closer look at the app in action.
FAQ
Common questions before you install.
What kind of OBD-II adapter do I need?
A Bluetooth Low Energy (BLE) ELM327 adapter — for example, Veepeak BLE+. Look for "BLE", "Bluetooth 4.0", or "Bluetooth 5.0" on the packaging. Older Classic Bluetooth adapters (often labeled "Mini" or "3.0") are not compatible and will not appear in the app's scan list.
Will leaving the adapter plugged in drain my battery?
BLE adapters typically draw 10–25 mA when active. On vehicles where the OBD-II port stays powered with the ignition off, that's a continuous load on top of your existing parasitic drain. For daily-driven vehicles it's generally fine; if the vehicle will sit for more than 2–3 days, unplug the adapter as a precaution.
Will this hurt my vehicle?
No. OBD-II is a read-only diagnostic interface by design, and the app never sends write commands. It only reads data the vehicle already reports to emissions inspectors and service technicians.
Does it work without an internet connection?
Yes. All diagnostic reasoning runs on your phone. The only network call is an optional one-time VIN decode against the public NHTSA database to identify your vehicle. Cloud AI explanations are optional and only run when you tap the button.
What vehicles are supported?
Any vehicle with a standard OBD-II port — that's most cars and light trucks sold in the US since 1996, EU petrol since 2001, and EU diesel since 2004. Heavy-duty trucks using J1939 are not supported.
Can I try the app before buying an adapter?
Yes — there's a built-in demo mode that loads a simulated run so you can see the full app experience with mock vehicle data. Look for "Try with demo data" inside the Help screen.
Does my data leave my phone?
Only if you opt in. Crash reports can be disabled in Settings. Optional Fleet Membership, which contributes anonymized data to improve the diagnostic models, is opt-in and can be revoked at any time.
Why does my health score change between drives?
The score reflects what the vehicle's sensors and trouble codes look like during a specific run. Different driving conditions, warm-up state, and the presence or clearing of DTCs all shift the score. The app records each run individually so you can see trends over time, not just a single number.
Get in Touch
Questions, feedback, or early-access requests.
Support: support@motoinsightsai.com
Privacy: privacy@motoinsightsai.com